

If that seems like accepted hitting strategy today ¨C since so many batters are trying to pull the ball in the air ¨C it wasnˇŻt quite that way a decade ago. Back then, Justin Turner told Eno Sarris that his career changed when former teammate Marlon Byrd turned him on to a new approach, describing the work as ˇ°the old saying is ˇ®stay back, stay back, stay back,ˇŻ [yet] he was talking about doing the opposite.ˇ± And it certainly wasnˇŻt that way back in 2002, when no less a slugger than Alex Rodriguez talked about the benefits he found in letting the ball get deeper.
In more recent times, players and teams have known exactly what happens where, right down to the inch. (ˇ°We know,ˇ± former Cubs coach Andy Haines told Sarris back in 2017, ˇ°the damage in the Major Leagues is done nine to 18 inches in front of home plate. You donˇŻt hit the ball deep, thatˇŻs the down part of your swing, because all the metrics show those are ground balls if you hit the ball deep.ˇ± That was eight years ago.)
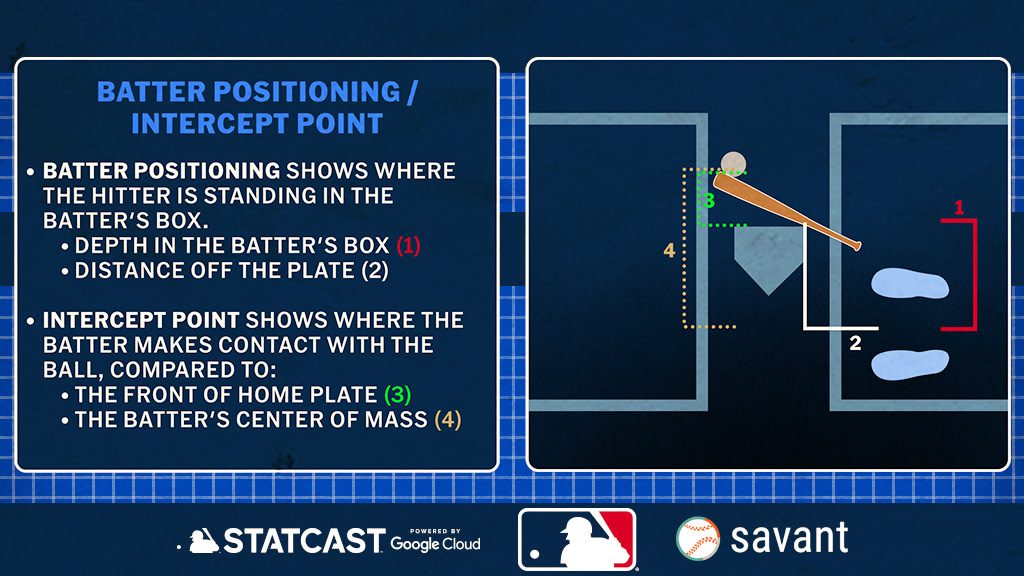
Now, you can too. The latest Statcast release on Baseball Savant highlights two areas of hitting that have been discussed basically forever, yet never really with accessible data ¨C where does a hitter stand, and where does he make contact? (Or, in the case of misses, where does he come closest to doing so?)
On Monday, we dug through some of the more interesting and outlier batting stances. Today, letˇŻs get into where you make contact ¨C and why it matters.
Start with the context: The average intercept point -- that's contact if made, or closest point to the ball if not -- is 30 inches in front of the player's center of mass. (Toward the mound, that is.) The range goes from the extremes of Cal Raleigh (as a righty hitter) at 41 inches out, to Paul Goldschmidt, nearly two feet deeper, at 19.
Since the data only goes back to mid-2023, itˇŻs difficult to know if GoldschmidtˇŻs extremely deep contact point is a product of aging or intent, though given that we can find quotes from D-backs executives from way back in 2015 saying ˇ°heˇŻs pretty patient ˇ he lets the ball get deep,ˇ± the latter is probably true. There's not one right way to do this.
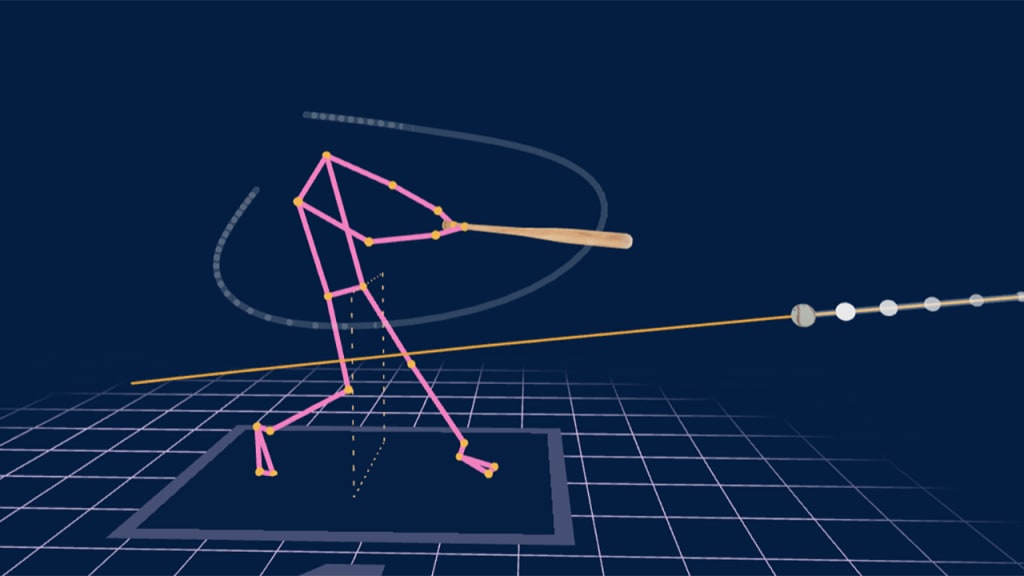
Knowing the average is 30 inches is a good place to start. ThereˇŻs a lot more to it than that. Everything weˇŻre about to discuss here is expressed in inches in front of the batterˇŻs center of mass, with the ˇ°intercept pointˇ± being either the point of contact, or the closest point to the ball if it was a swing-and-miss. WeˇŻre talking about No. 4, here.
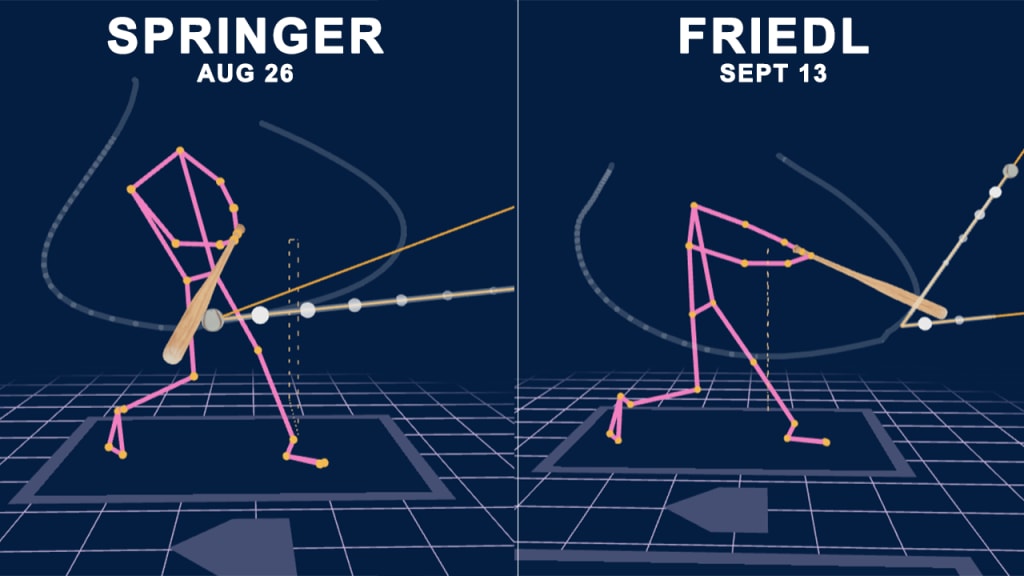
To show what that really looks like, take these two home runs from 2024, one by George Springer in August, and another by TJ Friedl in September. Taken from the broadcast view, theyˇŻre somewhat unremarkable. Taken from the side-by-side view, you can see somewhat that Friedl made contact further out in front.
But even that doesn't quite show you the full picture, and we picked these two for a reason, because they are the extremes.
SpringerˇŻs blast was the deepest in the zone anyone hit a home run last year (11 inches), and a righty wrapping one oppo around the Pesky Pole sure passes the smell test. FriedlˇŻs (53 inches) was the furthest out front anyone hit a homer last year, and again, a dead pull shot off a hanging breaker definitely looks right. You can really see the difference if you dig deep into the Statcast visualizations here.
ˇ°It all counts the same on the scoreboard,ˇ± you might say, and youˇŻd be absolutely right. Both Springer and Friedl drove in three runs that day. Both of their teams won. But in the same way that hitting the ball harder and swinging the bat faster tell you a whole lot about what type of player you are and might end up being, thereˇŻs a lot to learn about contact point too ¨C as the players themselves are telling you.
Turner, who once told no less an authority than John Smoltz exactly why he went from letting it get deep to catching it out front, still hits the ball out front all these years later ¨C 37 inches out front, to be exact ¨C one of the 10 largest figures in the game. At 39 years old last year, he was still an above-average hitter, and among those with 10 homers, no one hit those home runs further out in front than he did. Some things, it turns out, never change.
Hitting the ball out front, as youˇŻd expect, really is where power and production are found, just like Turner learned and Jenkins said. But itˇŻs not the right approach for everything, either. LetˇŻs find out why.
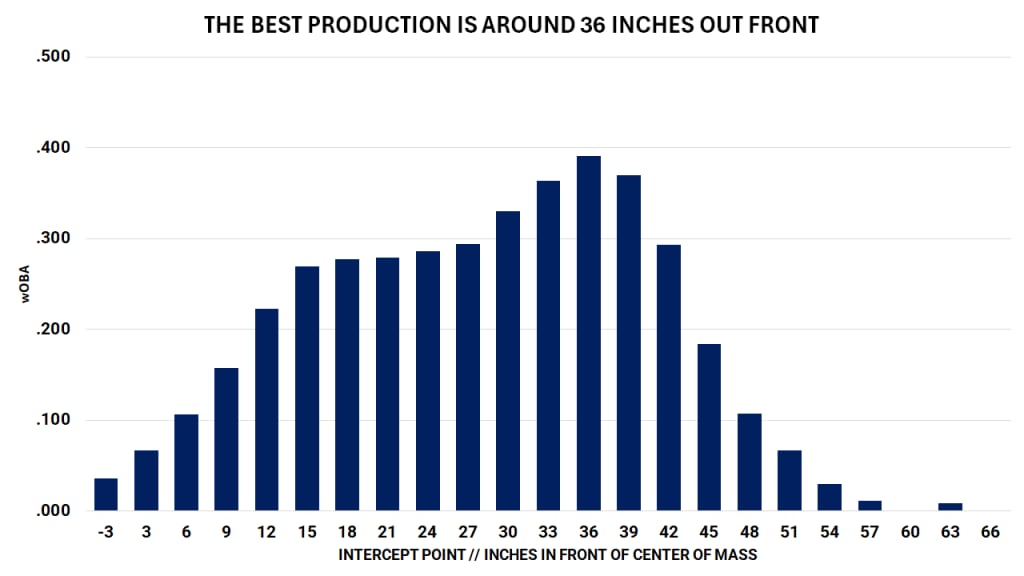
Where do you want to find homers? 36 inches out front.
Remember, here, that weˇŻre talking about inches (towards the mound) in front of a playerˇŻs center of mass, so while Haines said ˇ°9 to 18 inches,ˇ± he was talking about in front of the plate. Since we know players can shift all around in the box by two feet or more, itˇŻs more useful to look at where the specific player is standing.
Put everything into three-inch buckets, set a minimum of 100 competitive swings for each, and what we get for 2024 is ˇ a pretty clear pattern. If zero inches is a straight line directly in front of you (think positioning the bat handle on your belt, facing in front of you), then itˇŻs essentially impossible to hit a home run there. If the ˇ°averageˇ± intercept is 30 inches out front, then the average home run comes 36 inches out front ¨C or, more accurately, in the 36-38 inch bucket.
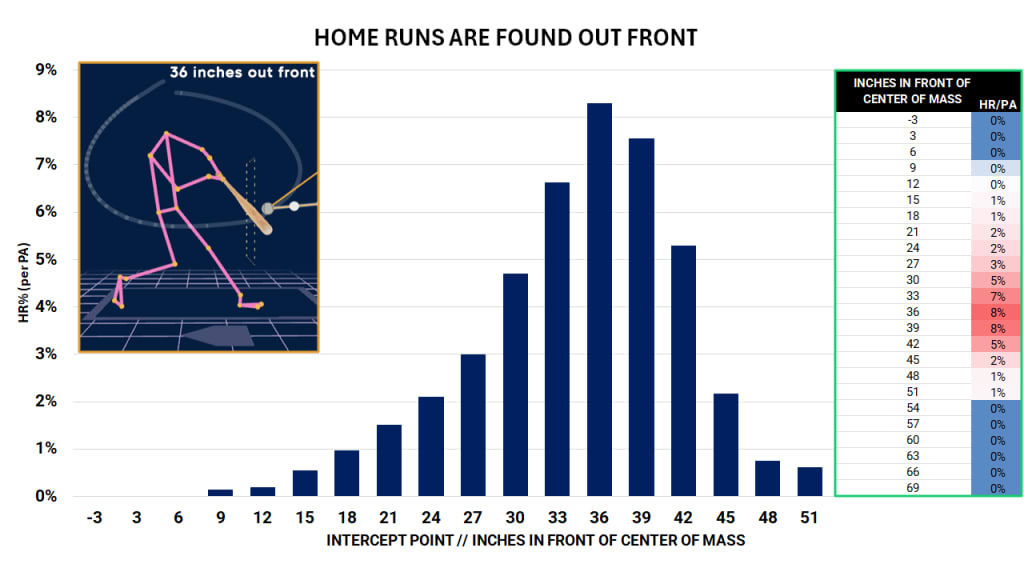
Another way to say it is that 82% of homers came between 25 and 45 inches out front. Another way to say it is that 0% of homers came any less than SpringerˇŻs 11 inches in front of his center of mass. If you let it get too deep, you simply give up any chance to do real damage. If youˇŻre too far out in front, youˇŻre probably badly fooled.
ItˇŻs not that hard to see why that is. Hitting it out front gives your bat more time to reach higher swing speeds ¨C as Davy Andrews found last year, pulling it is nearly a +4 MPH swing speed boost compared to going oppo ¨C and higher swing speeds are, of course, correlated to more damage.
Take Isaac Paredes, a noted pull-only power hitter, compared to Juan Soto, an all-fields power masher. Every single home run that Paredes hit last year came in a very narrow band in front of him, from 33 inches to 42 inches (again, in three-inch buckets). If he isn't making contact in that range, he isn't doing damage. Soto, meanwhile, has a much wider area of contact on homers, which is part of his greatness, because he can still do damage on a swing much, much deeper than Paredes -- or most anyone else.
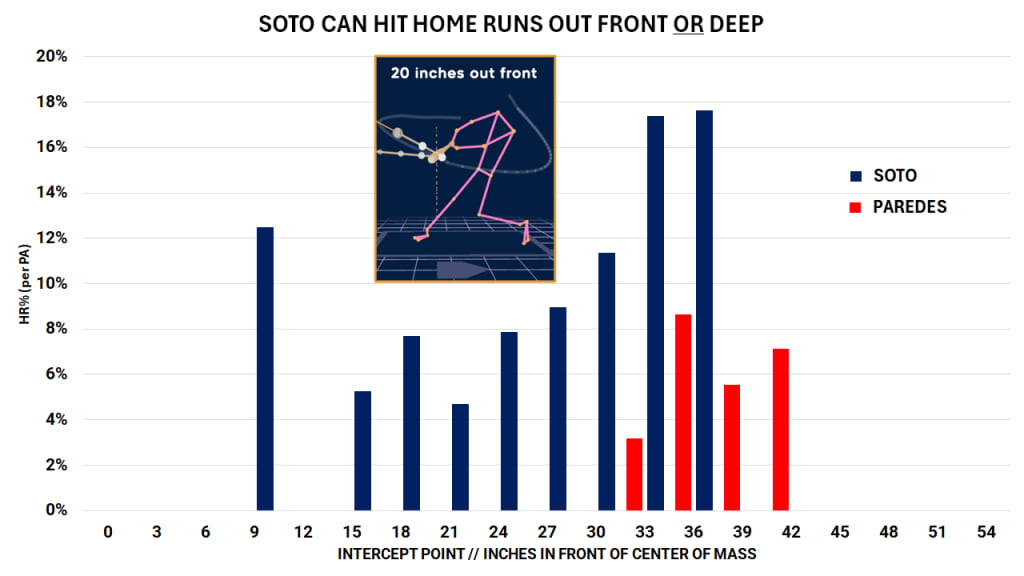
It matches the eye test, too. If we want to find one of those extremely shallow ¨C by home run standards ¨C dingers that Soto hit, just look at his Sept. 4 homer off of Nathan Eovaldi that he hit a mere 11 inches out front. It was outside, and you might even say Soto was a little late on it, but because heˇŻs Soto, it still became an opposite-field homer. While a pull-type like Paredes has to find contact almost at the perfect point to get it out, a legend like Soto has a lot more wiggle room.
WhereˇŻs the best production overall? Also 36 inches out front.
ThereˇŻs more to life than home runs, obviously. Do you like batting average? Well, 36 inches out front is still the way, though thereˇŻs really not a great deal of difference as long as youˇŻre in the 15-39-inch range.
More into something more advanced like Weighted On-Base Average (wOBA), which gives credit for extra-base hits? This tells the story of where you want to be, filling in the gaps of non-homer value. (Remember, this is just on swings, so walks, which are valuable, are not part of this.)
How, youˇŻre asking, could someone find any value hitting behind their center of mass? ItˇŻs rare, but sometimes, weird things happen, like when Bobby Witt Jr. was well behind a Brenan Hanifee fastball, yet still managed to tap it into fair play enough to beat out a hit and drive in a run.
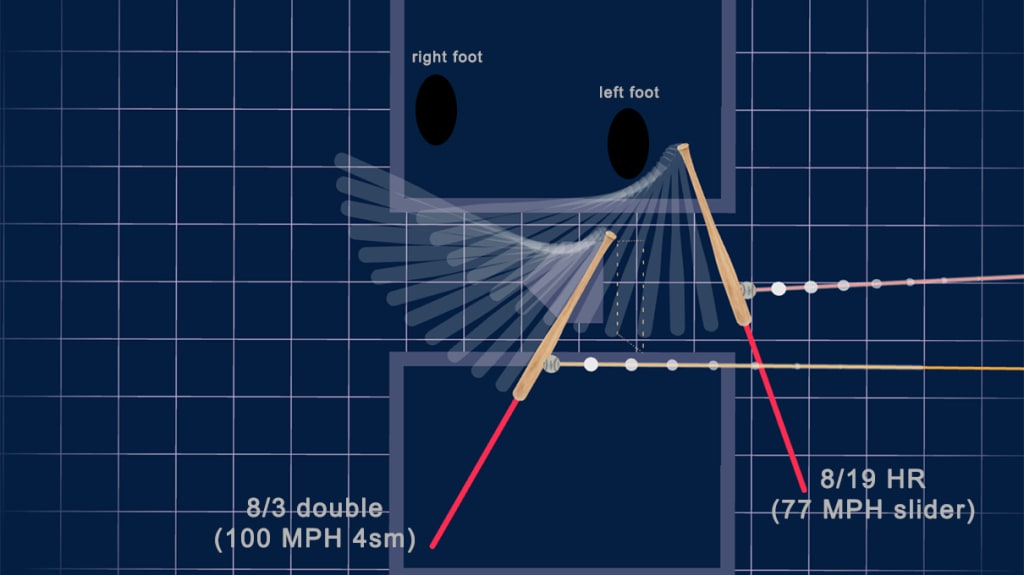
LetˇŻs cool it on the charts for a minute and show you what it really looks like to make different contact points, featuring a pair of Vladimir Guerrero Jr. extra-base hits from last August. One was a double off a 99.6 mph fastball; the other, a home run off a 77.3 mph slider. Unsurprisingly, he made contact further out front on the slower breaking ball, and in this case, itˇŻs about 30 inches of difference ¨C or nearly three feet. The pitcher has a say in all this, too.
But, importantly, itˇŻs different for different hitters. Aaron Judge makes his best contact 28 inches out front, because heˇŻs strong with a fast bat. Paredes, the extreme pull hitter, is closer to 40 inches out front, because he has relatively slow bat speed and he needs to get to the absolute peak of it to produce.
Where do you find the most contact? 30 inches out front.
Not everyone wants damage, though. Sometimes, you just want contact, and youˇŻd expect that to come a little deeper ¨C which, as it turns out, is true.
Look at what a pleasing shape the whiff percentage takes here, making it clear that if youˇŻre swinging too far out front, youˇŻre likely off balance or way out ahead of an offspeed pitch, though at least out there you might be working on a power trade-off. If your intercept point is too close to 0 degrees ¨C or, heaven help you, behind your center of mass ¨C you wonˇŻt find power or contact, for the most part.
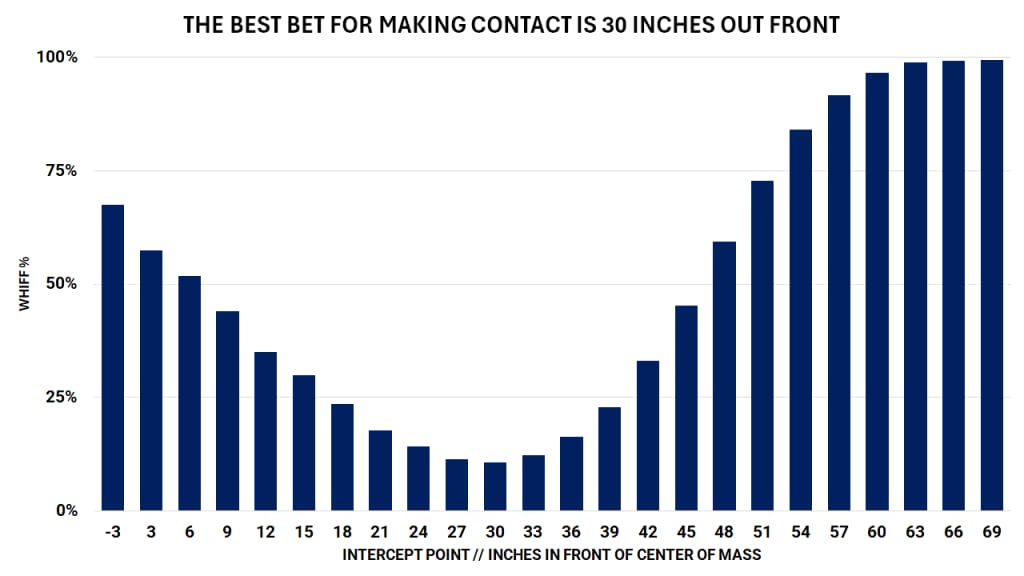
YouˇŻre dying to see, we know, what it looks like to swing and miss more than 60 inches out front, when the data says that such a swing is a near guaranteed miss. There really arenˇŻt that many, but they mostly look like this, big swingers being totally fooled on secondary pitches, like when Eloy Jim¨¦nez waved at this Chris Sale slider.
Maybe the video doesnˇŻt do it justice. It might be clearer in the side visualization view, which shows the swing already nearly complete before the ball even reaches the plate. You probably donˇŻt want to be finding contact like that. And, for the most part, you donˇŻt see it.
So where does it really all work out the best?
ThereˇŻs something else going on here, too.
If you look back at the batting average chart above, it never really zeroes out, but that doesnˇŻt mean youˇŻre adding value, either. For example: in the bucket of 6 to 9 inches out front, the average is all of .160 ¨C which is to say, lousy. But it could be worse, because thatˇŻs only on swings that result in contact or strike 3.
If we look at Run Value instead, we find a different story. Run Value looks at the value of every swing, not just the ones that end a plate appearance, so while batting average (or slugging, or OPS, or anything else) will ignore the effects of having the count go from 0-0 to 0-1, thatˇŻs exactly what Run Value was built for. Soto, for example, was second in the Majors with +73 batting runs, not only because of the value he added when making contact (+54 runs), but because of the value he added when he didnˇŻt (+19), thanks to his ability to work counts in his favor.
If we apply that across the Majors, what ends up happening is that the buckets between 33-42 inches out front are the only ones that return positive value for the batter. Everywhere else? You might not want to bother.
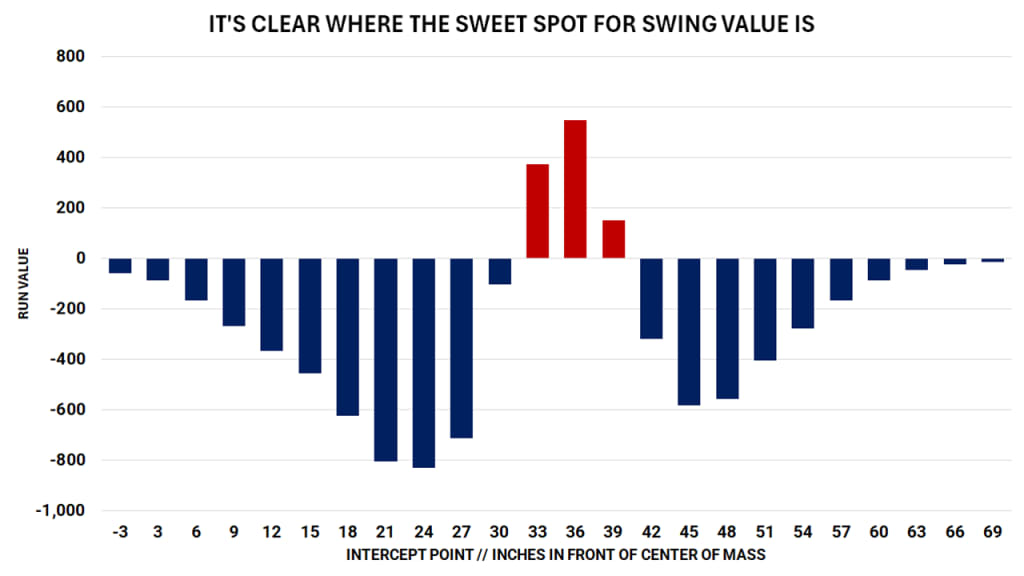
Now: why does it look like itˇŻs overwhelmingly negative figures? Because, remember, here weˇŻre only counting swings. Batters pile up so much positive value by not swinging at bad pitches outside the zone. Of course, when they hold, theyˇŻre not moving the bat ¨C and thatˇŻs not what weˇŻre showing here.
ThatˇŻs the next part of the story. If youˇŻre trying to do damage on swings, you want to get the bat out in front, just like Turner said years ago. But what about the premise that you might make better swing decisions in the first place by letting it get deeper, giving you more time to see whatˇŻs happening?
As always, we defer to Ted Williams, who said in 1966 that ˇ°the more time you give yourself to look at the pitch, the less you are going to be fooled,ˇ± yet also that ˇ°there's one very distinct disadvantage by being in the extreme into the box because breaking stuff is breaking bigger back there.ˇ±
Williams has rarely been wrong about much, baseball-wise. He would have loved these tools. ThereˇŻs always more to learn.